
Even the most powerful computers don’t last forever—otherwise we’d all still be running the PCs we had decades ago. But trying to figure out when a laptop or desktop has passed its sell-by date isn’t an exact science.
You might feel like applications and websites aren’t as snappy as they used to be, but it’s difficult to know for sure when you’re using your computer every day. Here we’re going to introduce some helpful tools that can be more objective in their assessments.
These tools should help you decide when it’s time to upgrade to a new computer, and when it’s time to give your current one a spring clean. We’ve also previously written about ways to speed up Windows, speed up macOS, and speed up your web browsing.
Built-in analysis tools

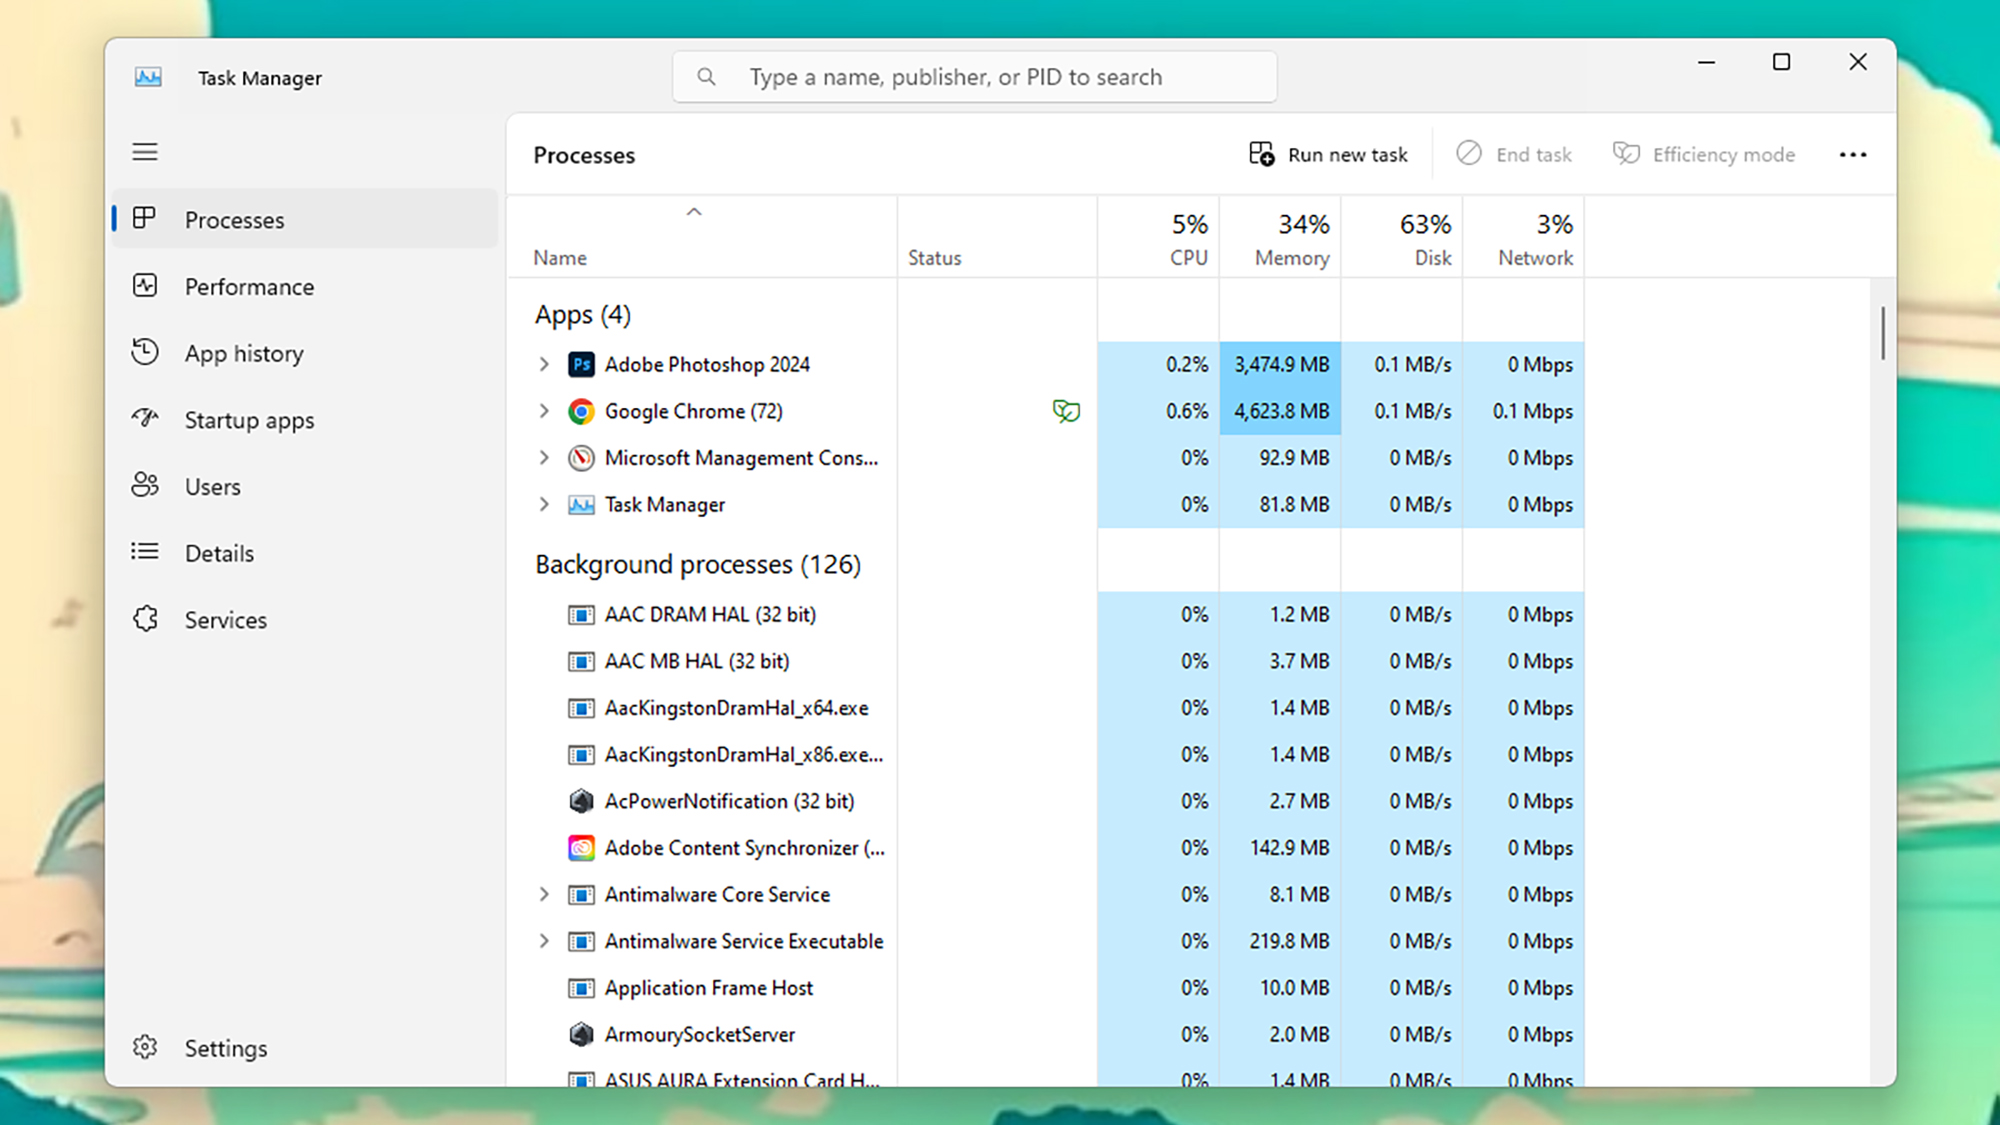
Both Windows and macOS come with built-in tools for monitoring system performance. On Windows, it’s Task Manager: Right-click on a blank area of the taskbar, then choose Task Manager. Under the Processes and Performance tabs you get a host of details about how your system’s resources are holding up under the software weight—so you could regularly note these figures week by week (or month by month) to look out for any kind of degradation.
Task Manager itself doesn’t keep any historical data, but a more advanced tool called Performance Monitor does—you can search for it and launch it from the Start menu.
- Right-click on User Defined under Data Collector Sets.
- Choose New and Data Collector Set.
- Name the set, pick Create from a template, then click Next.
- Choose System Performance and Finish.
Using the Action and Start commands you can run a diagnostics check manually, or you can right-click on your new report, then choose Properties and Schedule to have it run automatically every so often.
Performance Monitor isn’t the most user-friendly of tools, so you might find it easier to just keep your own records of Task Manager activity—but if you do want to dig into these performance stats in more detail, it’s an option. If you need more help with the ins and outs of the tool, check out Microsoft’s Performance Monitor guide.
On macOS, the tool you want is Activity Monitor, which you can find by opening Finder and choosing Utilities from the Go menu. As with Task Manager, you can see how busy your system processor, memory, and drives are. There’s no easy way to log this data automatically though, so you’ll have to run Activity Monitor regularly and manually note down the figures you see, to check for performance issues over time.
Benchmarking tools

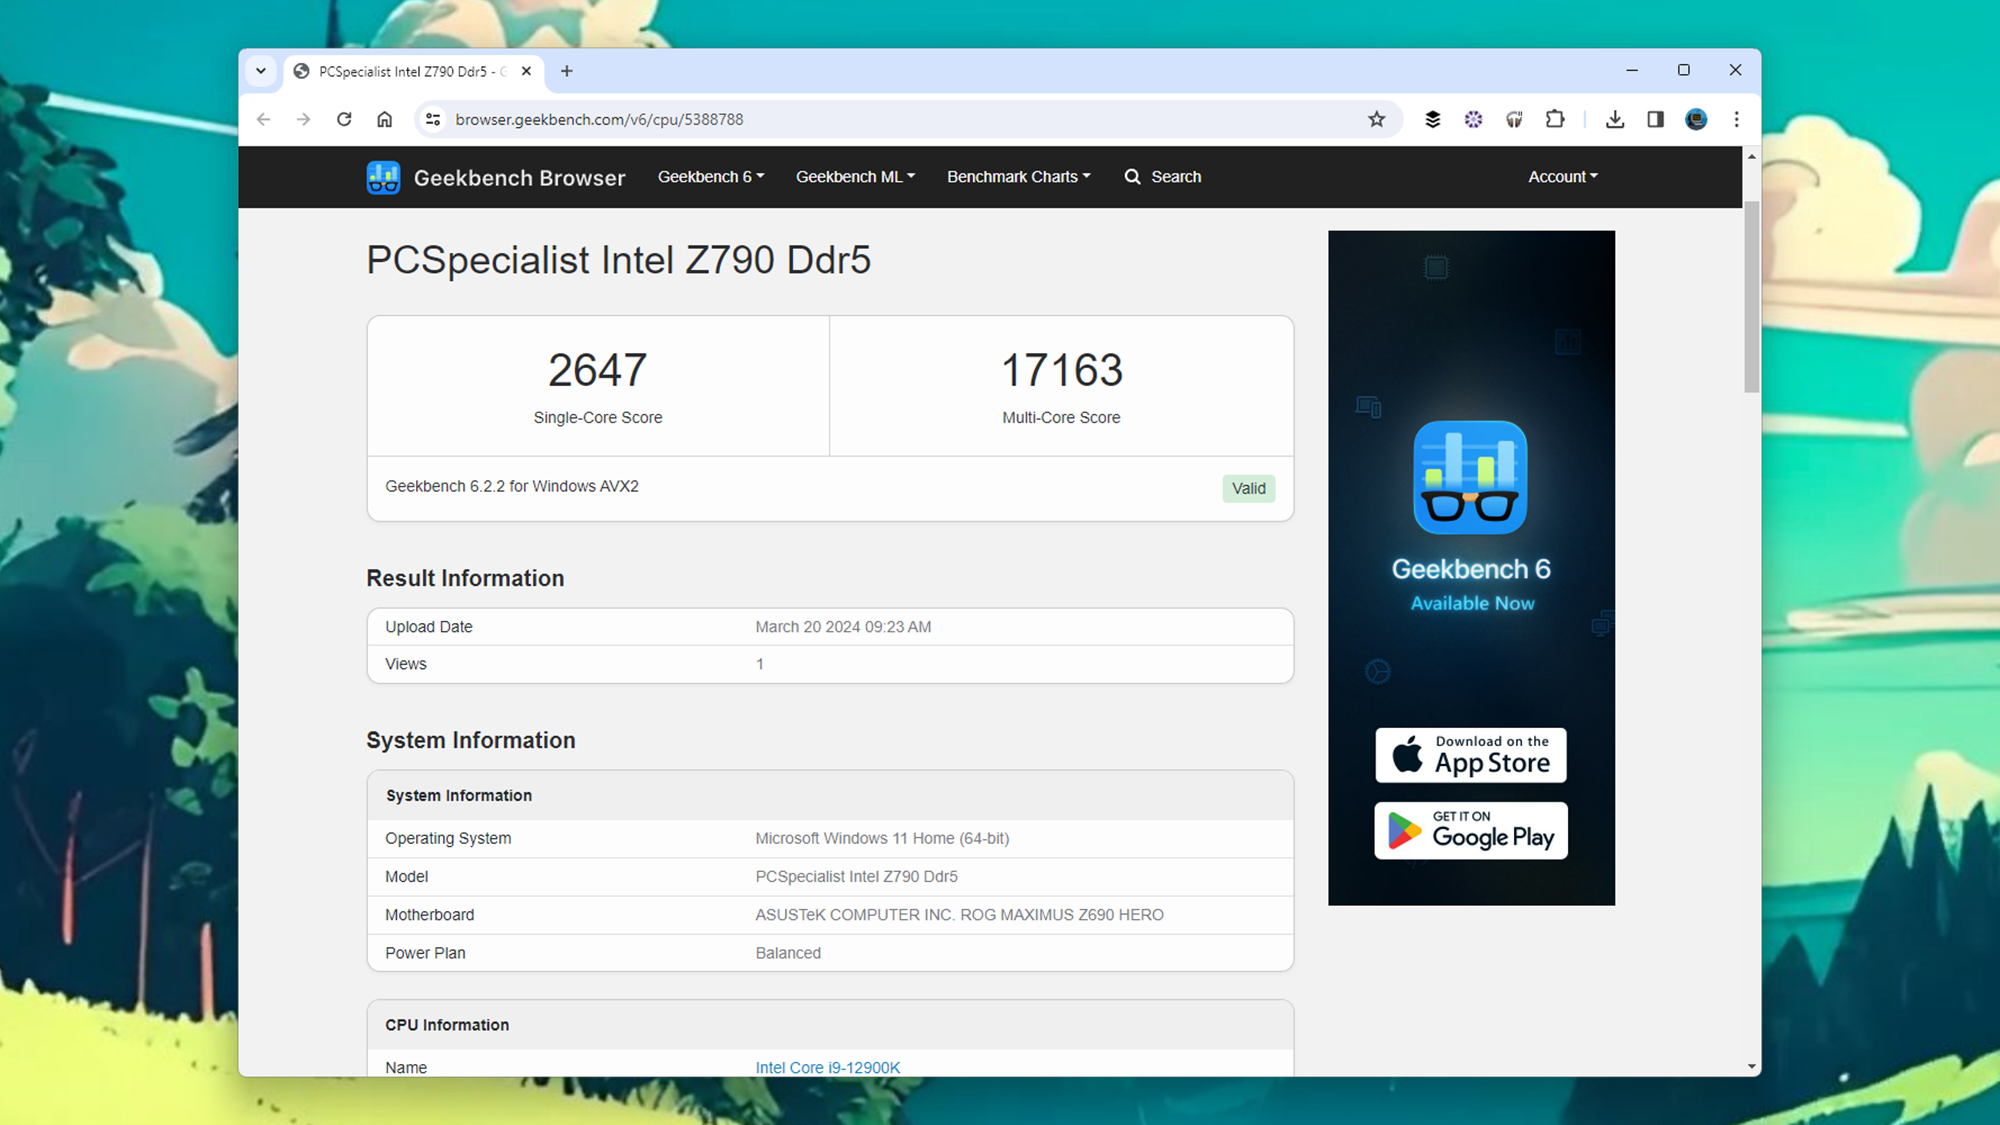
Third-party benchmarking tools put key components of your computer system to the test and report back on performance. The idea is you run them regularly, note down the scores, and then chart the scores over time to watch out for drops in performance. The tools we’ve listed here are free, but come with paid upgrades for more advanced features (like more extensive tests, and more comprehensive reports).
For Windows and macOS, Geekbench has long been one of the most reliable benchmarking programs out there, and it’ll give your system’s main processor (CPU) and graphics processor (GPU) a good workout. Cinebench is also cross-platform and worth a look, and is often used by professionals to stress test the CPU and GPU.
Disk drives are often the parts of computers that start to fail first, and you can get benchmarking software to look specifically at your system storage. We like CrystalDiskMark for Windows computers and Blackmagic Disk Speed Test for macOS: They’re both straightforward to use and will give you plenty of information about how your drives are holding up.
You may well spend a lot of your computing time inside a browsing window, and there are benchmarks to test browser performance too. Speedometer is a good place to start, as it’s been developed in association with all the major browser companies, but JetStream is another solid option that tests browser start up and website rendering times.
Recording key indicators

There’s nothing wrong with going slightly more basic with your tech: Get your stopwatch out (or the stopwatch on your phone), and time how long it takes for your computer to start up and shut down. These processes are both good barometers of how healthy your Windows or macOS machine is, and how much strain it’s under.
Of course, you’re going to have to do this over several days or weeks to spot if there’s a reduction in performance. Once you’ve got a few data points built up though—in a spreadsheet, maybe—you should have a useful indicator of how your computer’s performing and in which direction that performance is headed.
You can do this with applications as well, though the launch times will be quicker in this case, and any slowdown will be more gradual. If you’ve got a particularly demanding program on your system, like a video editor, you could look at this in particular—and measuring the time it takes to do other tasks, like rendering 4K video, could help as well.
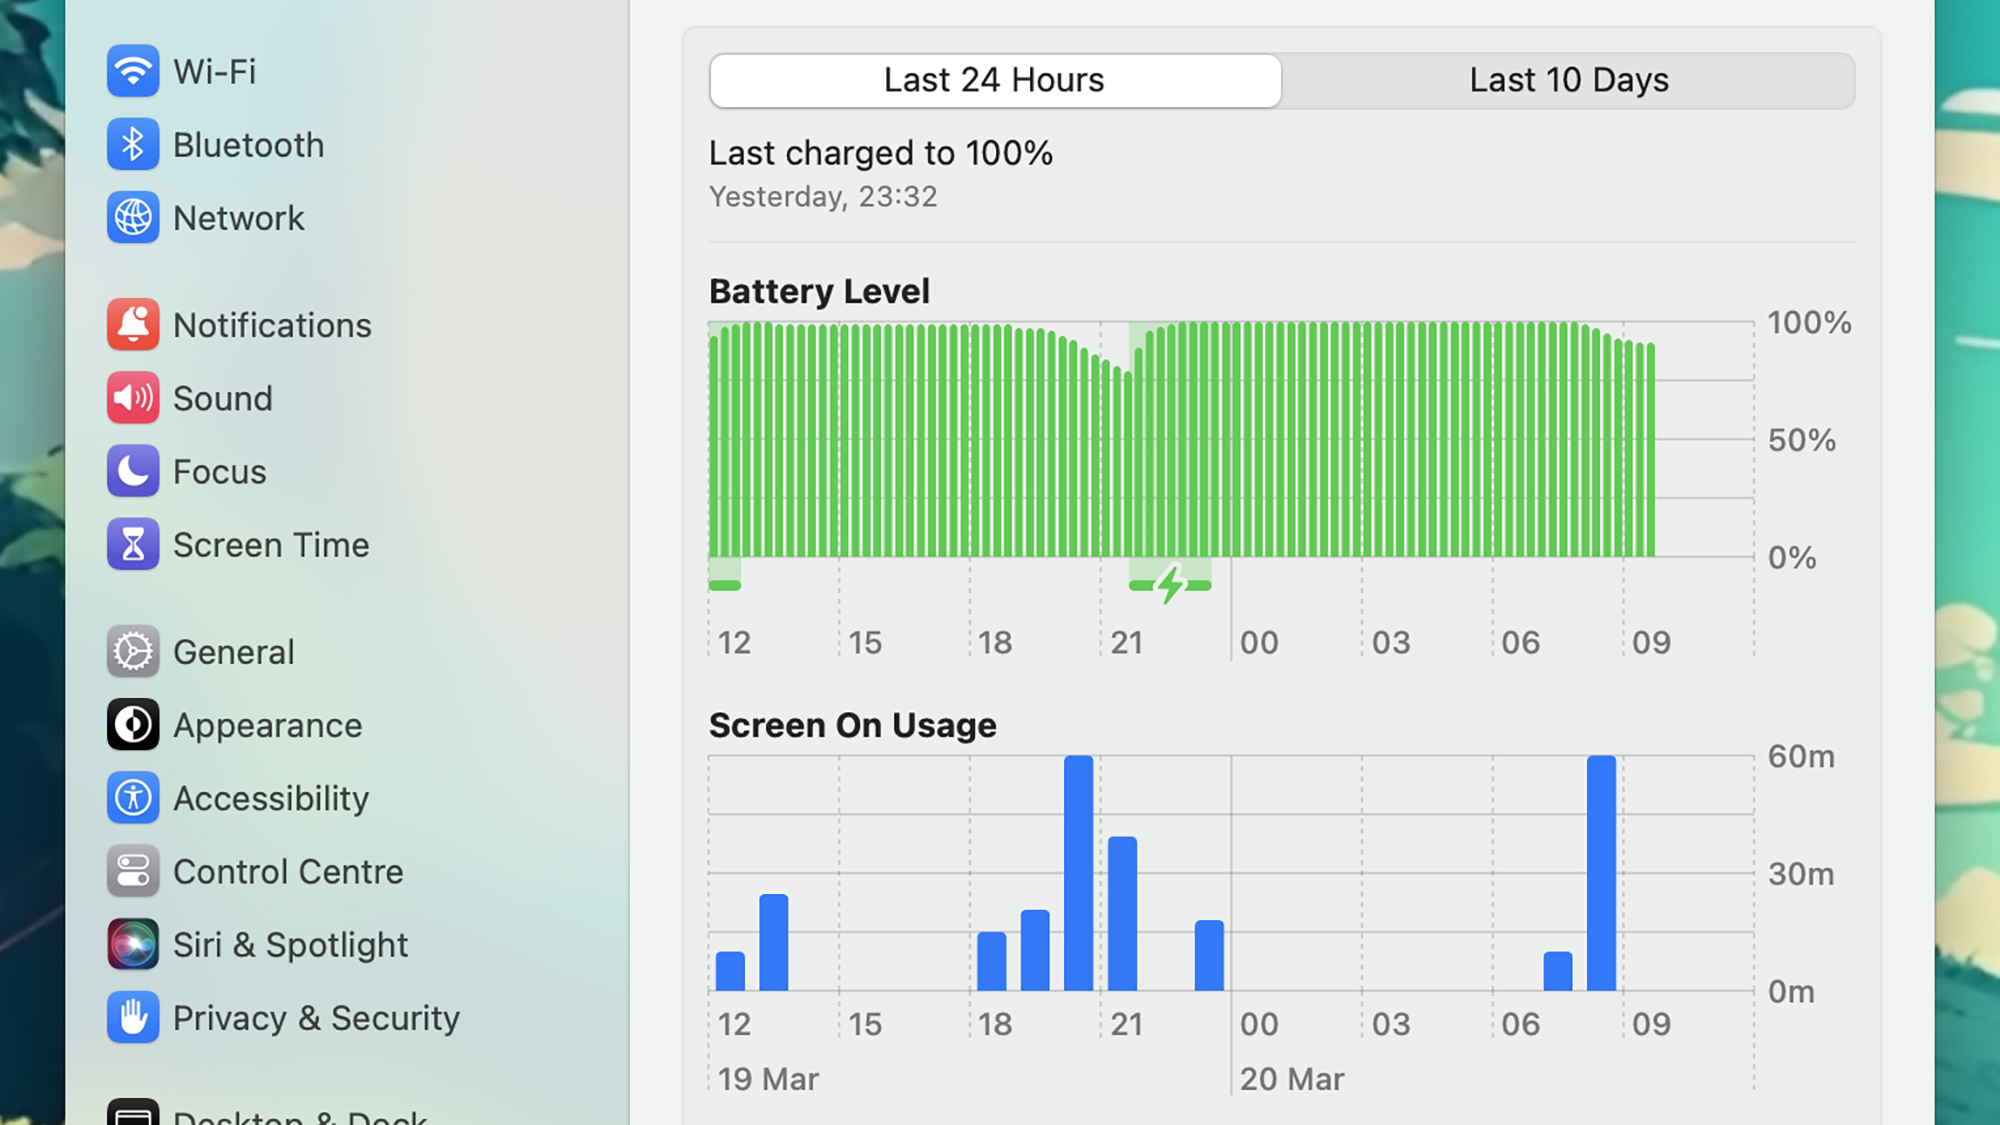
For laptops, battery life can be timed in the same way, and is another indicator of the health of your computer: Components running slower and under more stress tend to use up battery power faster. If you’re measuring time between battery recharges though, make sure you’re doing the same activities on your computer to get a fair comparison (gaming will suck up a lot more battery power than emailing, for example).